

English
Resource comparison
Performance figures are from the same-source baseline tested on 2026-10-30, not a new measurement of the SmartAPI 1.0.0 release image. Original conditions and evidence are retained.
SmartAPI uses Go + SQLite, supports headless operation and requires no external database.
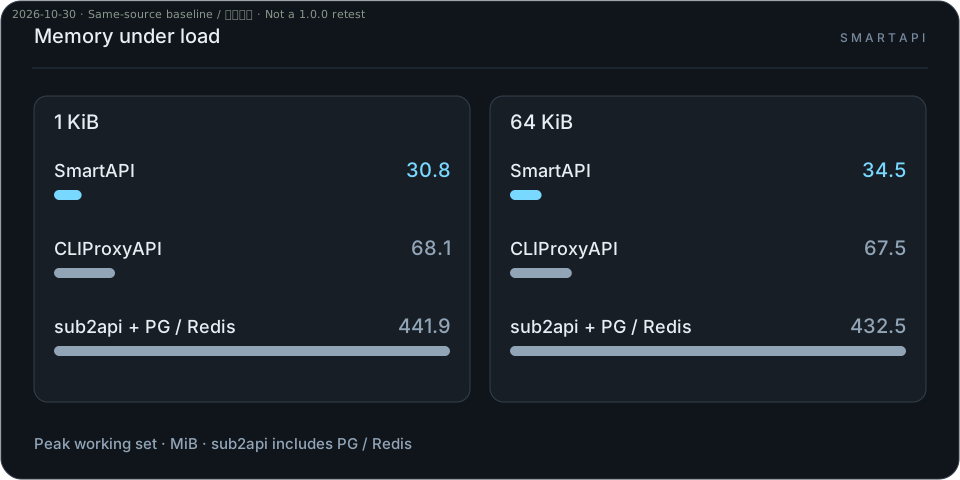
Memory usage
| Project | 1 KiB response: peak working set | 64 KiB response: peak working set |
|---|---|---|
| SmartAPI | 30.8 MiB | 34.5 MiB |
| CLIProxyAPI | 68.1 MiB | 67.5 MiB |
| sub2api + PostgreSQL + Redis | 441.9 MiB | 432.5 MiB |
In the 64 KiB case, SmartAPI used about 49% less working-set memory than CLIProxyAPI and 92% less than the sub2api stack.
Peak CPU usage
| Project | 1 KiB response | 64 KiB response |
|---|---|---|
| SmartAPI | 146.6% | 157.1% |
| CLIProxyAPI | 151.0% | 151.2% |
| sub2api + PostgreSQL + Redis | 390.2% | 406.3% |
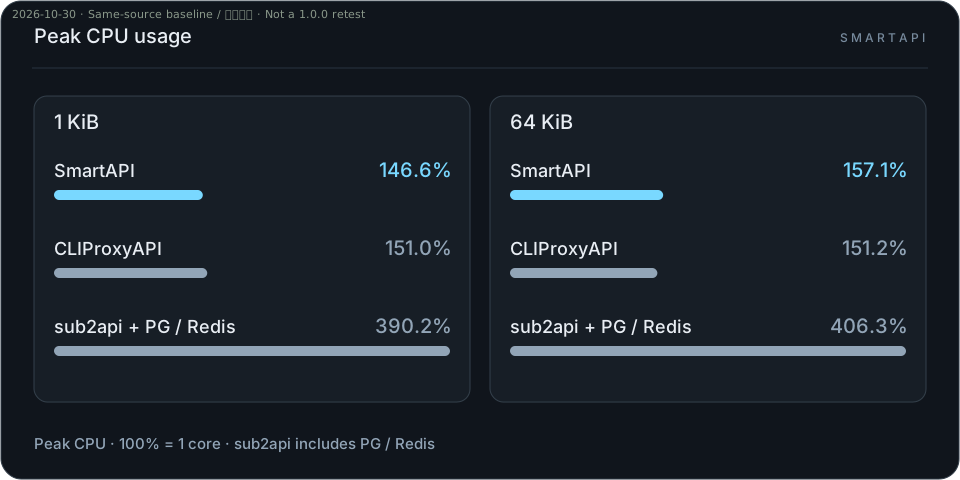
Tested 2026-10-30 on ARM64 Docker, concurrency 32, zero-delay Mock. Each gateway: 2 vCPU. sub2api additionally uses PostgreSQL 2 vCPU and Redis 1 vCPU, included in totals. Same-source headless baseline candidate (original identifier 1.1.0): 3×15 s; CLIProxyAPI 8.0.47: 3×12 s; sub2api 0.2.19: 1×30 s per case. Features and measurement windows differ; these are resource measurements for these configurations. Memory is working set, not RSS; sub2api sums component peaks.
Method
Sizes refer to response content bytes; input text is 128 bytes. OpenAI Chat JSON over HTTP/1.1, no compression. Apple M1, Docker VM with 8 vCPU and about 8 GiB, non-exclusive host; one gateway tested at a time.
SmartAPI retains authentication, ledger, sessions and request traces. CLIProxyAPI uses commercial-mode with management and usage aggregation disabled. sub2api uses simple mode with its usage database enabled.
Working set is cgroup usage minus inactive_file, sampled about once per second; repeated runs use the median of run peaks. sub2api component peaks need not occur simultaneously. Peak CPU is the CPU-time delta between consecutive monitor samples divided by the read-time delta, multiplied by 100%; 100% means one logical core. sub2api sums its gateway, PostgreSQL and Redis within each sampling interval before taking the run peak. Repeated runs use the median of run peaks. The monitoring window includes startup and ledger-drain observation, excluding Mock and load-generator costs.
Per-run CSV · All measured metrics · Build provenance
Downloads retain all measured metrics. This page shows memory and peak CPU for all three projects. Tools: scripts/perf/; figures: scripts/build_performance_figures.py.
CPU intervals and calculation data, extracted from the same resource samples by scripts/perf/export_peak_cpu.py.